This is not an official SIRT announcement. Juniper SIRT does not comment on issues in which Juniper products are not vulnerable. SIRT is still reviewing our broad portfolio and, if an issue is discovered, they will issue an appropriate advisory here.
"This is the best article and test we have to date on the BlackNurse attack. The article provides some answers which are not covered anywhere else. The structure and documentation of the test is remarkable. It would be nice to see the test performed on other firewalls – good job Craig ”
Lenny Hansson and Kenneth Bjerregaard Jørgensen, BlackNurse Discoverers
On November 10th, 2016, Danish firm TDC published a report about the effects of a particular ICMP Type+Code combination that triggers resource exhaustion issues within many leading Firewall platforms. The TDC SOC has branded this low-volume attack BlackNurse, details of which can be seen here, and here.
Over the past few weeks, Firewall vendors have been coming out with their own unique perspective on the issue. Out of those vendors who have made public statements, none have provided any information as to exactly what can be expected when this attack targets a host behind their security device.
As we were curious ourselves, we went ahead and created a lab environment to test both our products and the products of a few of our competitors. With regards as to why Fortinet and Cisco were omitted from our list, the community has taken care of testing for us (as you can see here under the list of affected products). Fortinet has posted a blog in response which recommends deploying a separate DDoS appliance to defend against these types of attacks.
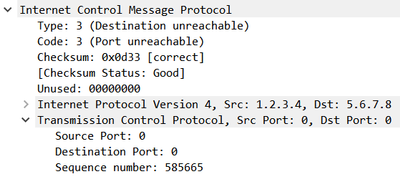
For those of you interested in the makeup of a "BlackNurse" packet, I have included a screenshot from Wireshark below. These packets include a full 5-Tuple about the supposed session they're referencing: Source IP, Source Port, Destination IP, Destination Port, and Protocol. We will discuss why this is important later on.

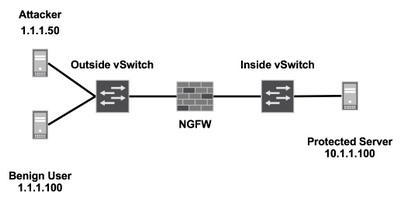
To ensure we were comparing "apples-to-apples" between our product and our competitors, we turned to virtualization. Virtualizing our test bed provided us with the ability to abstract hardware advantages of one vendor from another. If each device has an identical amount of compute assigned, one can easily determine whose software is superior for a given task.
I will be including the exact makeup of our test bed below for those of you who wish to replicate and/or deeply analyze the results.

The ESXi 5.5 host used in our lab had the following components:
- 2x Intel Xeon L5520 CPUs
- 82GB of DDR3-1333 ECC Memory
The Attacker, Benign User, and Protected Server were configured with relatively low specifications:
- 2x vCPU
- 2GB RAM
- 1x VMXNET3 NIC
- Running Ubuntu Server 16.04 LTS with tcpdump, hping3, and wireshark-common (for capinfos) installed.
Each NGFW under test had the following resources assigned:
- 2x vCPU
- 4GB RAM
- 3x VMXNET3 NIC's (Management/Outside/Inside)
- Latest Operating System:
Juniper vSRX was tested on Junos 15.1X49-D60
Palo Alto PA-VM was tested on PAN-OS 7.1.6
Check Point vSEC was tested on R77.30 with the latest Jumbo HFA and deployed as a standalone gateway.
Check Point's dedicated management station was powered off during testing to avoid skewing results due to increased load on the ESXi host.
Each VM is utilizing paravirtualized VMXNET3 interfaces to maximize their potential performance and interrupt handling. As our competitors do not have the capability to utilize SR-IOV, this was not leveraged by the vSRX during testing.
The Test Plan
For the purpose of our experiment, we created ideal circumstances under which to identify the maximum amount of BlackNurse traffic a given solution can support. To elaborate, each NGFW had:
- A single rule which permits any source to any destination with any application
- No Network Address Translation (NAT)
- No Logging
- No advanced or CPU-intensive features such as IPS
The test was run in two stages, each with two degrees of flooding (Low and High)
A simple PASS or FAIL is assigned based on the Benign User's ability to fetch the index.html from the Protected Server's NGINX server within a generous fifteen seconds. This fetch is only executed once the flood has been active for one minute. The test attempts validate resource availability of the protected host during the Denial-of-Service (DoS) attack. Failing this test indicates that the protected host has become unavailable and that the DoS attack can be considered successful.
Prior to executing the attack, each test bed is validated to ensure a successful fetch is able to complete in less than 0.01 seconds:
$ time wget 10.1.1.100
--2016-11-27 15:30:40--  http://10.1.1.100/
Connecting to 10.1.1.100:80... connected.
HTTP request sent, awaiting response... 200 OK
Length: 612 [text/html]
Saving to: ‘index.html’

100%[======================================>] 612         --.-K/s   in 0s

2016-11-27 15:30:40 (74.8 MB/s) - ‘index.html’ saved [612/612]


real    0m0.005s  <----
user    0m0.000s
sys     0m0.000s
A strict timeout is enforced during the test utilizing the 'timeout' command. If the request has not completed within the time specified, the timeout utility will kill the attempt and the process will exit.
Example of a failed attempt:
$ timeout 15 wget 10.1.1.100
--2016-11-27 15:34:32--  http://10.1.1.100/
Connecting to 10.1.1.100:80...
$
For those of you following along at home, if you do not have a packet-generator at your disposal, you can use hping3 to generate the required ICMP Type 3 Code 3 packets. A word of caution: You will notice that if a device is more adept at handling an arbitrary flood, hping3 will be able to send more traffic to the target due to the increased availability of resources on the ESXi host. The numbers included in the results below have been normalized to reflect this.
Running the following string on the Attacking Machine generated 40 Megabits-per-second (Mbps) or 75,000 Packets-per-second (PPS) of BlackNurse traffic destined to the Protected Server. Each packet is 70-bytes in length.
hping3 --icmp -C 3 -K 3 -i u1 10.1.1.100
For the full flood test, this string generated 165 Mbps / 295,000 PPS from the Attacking Machine
hping3 --icmp -C 3 -K 3 --flood 10.1.1.100
The Results

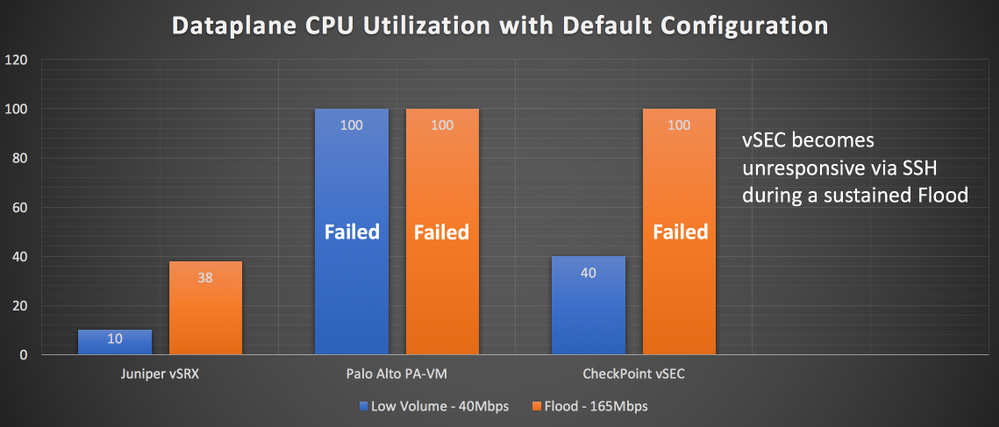
At first glance, these results may surprise some of you. Why does Palo Alto suffer significantly more than others during the Low Volume attack?
The answer is relatively simple. Remember the 5-Tuple we discussed earlier? Both Juniper SRX and Check Point analyze the inner header of the ICMP packet before making a forwarding decision, while Palo Alto does not. As a result, both the Check Point and the SRX Firewalls drop the BlackNurse packets, while Palo Alto is forced to consume resources forwarding the traffic to the internal server.
Check Point looks to see if the ICMP destination matches the inner source IP defined within the packet.
You can see that here from a kernel debug:
;[cpu_1];[fw4_0];fw_log_drop_ex: Packet proto=1 1.1.1.50:771 -> 10.1.1.100:3379 dropped by fw_icmp_stateless_checks Reason: ICMP destination does not match the source of the internal packet;
Juniper SRX take this one step further by analyzing whether or not there is an established session for the embedded 5-Tuple within the packet. Using this technique, the SRX ensures that the traffic is matching a legitimate session and not being spoofed by an attacker.
From flow traceoptions:
Nov 24 22:35:26 22:35:23.626086:CID-0:THREAD_ID-01:RT:  ge-0/0/0.0:1.1.1.50->10.1.1.100, icmp, (3/3)
Nov 24 22:35:26 22:35:23.626090:CID-0:THREAD_ID-01:RT:  packet dropped, no session found for embedded icmp pak
Check Point's solution went unresponsive under high-load due to their lack of resource separation between management and forwarding planes. The separation of Routing-Engine and Packet-Forwarding Engine is a fundamental tenet of Juniper platforms. We strongly believe that at no point should the processing of transit traffic affect the overall stability and manageability of the device in question.
 vSRX included with both mitigation options
These results are more in line with what we would expect to see from top-tier vendors, with Palo Alto being the notable exception once again. It appears as though their software is not as efficient as others when dealing with high packet-rate scenarios. My current assumption is that their poor performance is due to an inefficient softIRQ handler which may not be exposed in their physical solutions. Because Palo Alto implements anti-DoS mechanisms in hardware when available, just like Juniper, it is possible these software routines have not yet been optimized to function effectively when said hardware is absent.
Check Point's anti-DoS mechanism was shown to be very similar to the SRX's ICMP Screen feature in terms of raw performance. While not an easy feature to deploy correctly (unlike Screens), it is quite effective. For those interested in seeing how complex managing these rules can be, please see here for some examples. Unfortunately for Check Point, they also lack the ability to push these rules into an ASIC or FPGA to handle these attacks at large scale. They are inherently limited by the performance of the x86 architecture.
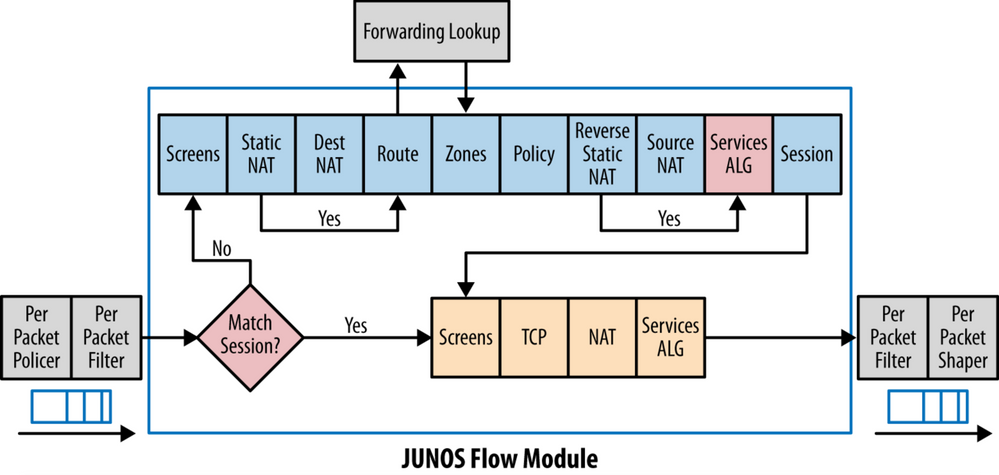
On that note, for those curious as to why Packet-Filters are the most efficient solution at handling these types of attacks in software-based platforms, consult the SRX's flow diagram to see when packet-filters take effect on a given flow:

As you can see above, both Policers and Packet-Filters take effect before a session-lookup occurs, saving precious time and system resources when dealing with large DDoS attacks. The added benefit with our physical SRX is that flood-based Screens are pushed down into our ASIC-based Network Processors (NP's) to handle attacks like this at line-rate (up to 240Gbps per line-card) with no impact to system resources.
Now that you have seen the results, this is the baseline configuration which was used on the vSRX:
set version 15.1X49-D60.7
set system host-name vSRX
set system root-authentication encrypted-password "$5$CM/Zzr55$kET7anrM32v0KxpwOVyPJcT3HTALY9pNcdx.Rw8K6U3"
set system services ssh
set security policies global policy Permit_Any match source-address any
set security policies global policy Permit_Any match destination-address any
set security policies global policy Permit_Any match application any
set security policies global policy Permit_Any then permit
set security zones security-zone Outside interfaces ge-0/0/0.0
set security zones security-zone Inside interfaces ge-0/0/1.0
set interfaces ge-0/0/0 unit 0 family inet address 1.1.1.1/24
set interfaces ge-0/0/1 unit 0 family inet address 10.1.1.1/24
set interfaces fxp0 unit 0 family inet address 192.168.0.5/24
To enable Screens on the Outside Zone and to enable ICMP Flood protection, these two lines were added:
set security screen ids-option BlackNurse icmp flood threshold 100
set security zones security-zone Outside screen BlackNurse
While Policers would also be highly effective for this purpose, during this test we used a simple Packet-Filter to discard all ICMP Type-3 Code-3 packets ingressing into our Outside interface:
set firewall family inet filter BlackNurse term 1 from protocol icmp
set firewall family inet filter BlackNurse term 1 from icmp-type unreachable
set firewall family inet filter BlackNurse term 1 from icmp-code port-unreachable
set firewall family inet filter BlackNurse term 1 then discard
set firewall family inet filter BlackNurse term 2 then accept

set interfaces ge-0/0/0 unit 0 family inet filter input BlackNurse
Appendix
This section will include Answers to common questions not addressed above.
Q) Will you be sharing the device configurations used during testing?
You can find the vSRX config above, but Check Point and Palo Alto configurations are included below for posterity. The DoS-prevention mechanisms for each platform were configured to take action after 100 packets-per-second of ICMP flooding.
- Check Point (policy was any/any/accept)
- Palo Alto
Q) How was CPU utilization determined?
- Juniper: 'show security monitoring'
- Check Point: Utilizing 'ps aux' and 'top', tracking the assigned fw_worker core. Reaching 100% on this core creates a DoS scenario as seen in Test 1.
- Palo Alto: There was some discrepancy with regards to dataplane CPU reporting within the VM. Generally, one would run 'show running resource-monitor' to display the current utilization for the dataplane. However, this was not reporting figures in line with device behaviour. Metrics from the 'pan_task' process proved to be much more reliable when taken from 'show system resource follow'.
Example: The PA-VM is suffering from 100% packet loss during Test 1 but only reporting 50% dataplane utilization, whereas pan_task is reporting 100%+.
 show running resource-monitor
 show system resources follow