Juniper Networks is excited to announce the availability of our App in Splunk's marketplace, Splunkbase. You can find it here.
Leveraging the rich reporting capabilities of SRX Series Next-Generation Firewalls, Splunk users can now monitor, analyze, and evaluate threats in real-time through a unified dashboard.
Diving In
The Overview Dashboard aims to be a holistic review of your environment, presenting you with details on threat events, network-based exploits, prolific malware, infected hosts, and which applications are consuming the most bandwidth.
 Overview Dashboard
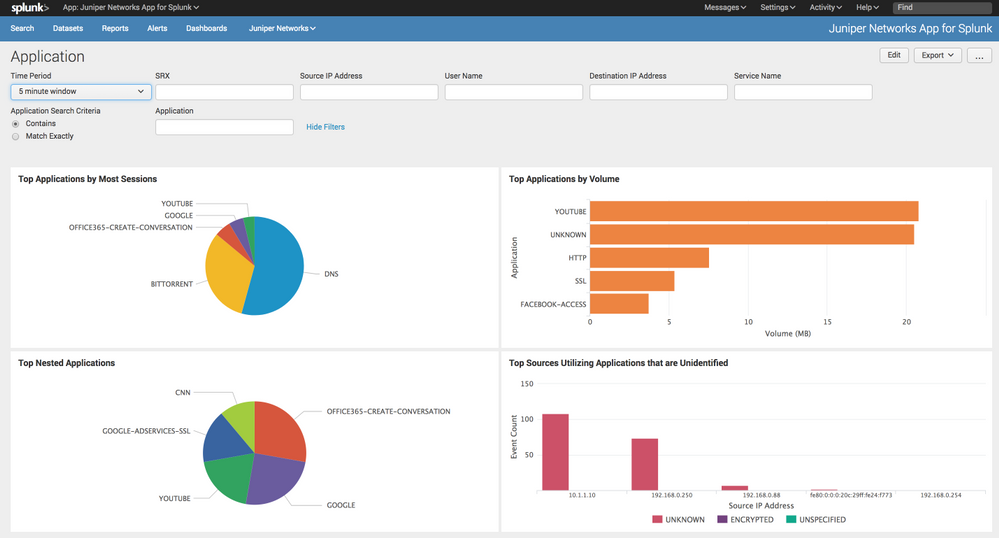
The Application Dashboard provides information on:
- Top Applications by Session Count
- Top Applications by Volume
- Top Nested-Applications
- Top Sources utilizing Unknown or Unspecified-Encrypted Applications
 Application Dashboard
The Firewall Policies Dashboard provides information on:
- Top Firewall Policies by hit-count
- Top Denied Firewall Policies by hit-count
- Top Firewall Policies by Bandwdith consumed
 Firewall Policies Dashboard
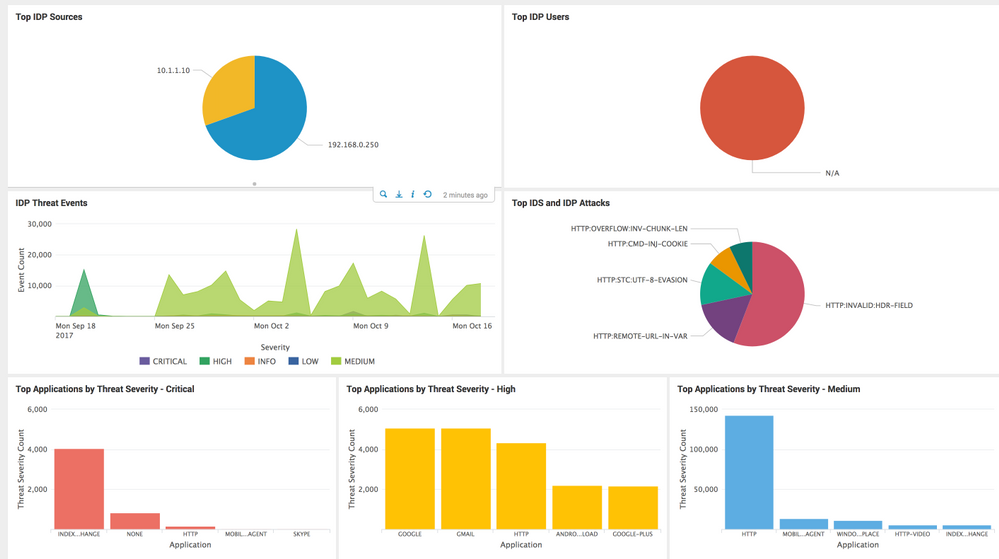
The IDP Dashboard provides information on:
- Top Sources triggering IDP events
- Top Users triggering IDP events
- Top Signatures being triggered
- Threat Severity trends (Critical, High, Medium, Low, Informational)
- Top Applications by Threat Severity for Critical, High, and Medium severity attacks
 IDP Dashboard
The Web Filtering Dashboard provides information on:
- Top URL Categories
- Top URLs being accessed
- Top Users attempting to access URLs which are being denied
- Top URLs being permitted by policy
- Top URLs being denied by policy
 Web Filtering Dashboard
The Sky ATP Dashboard provides information on:
- Top Users and Client IP Addresses generating Malware events
- Top Users and Client IP Addresses communicating with Command-and-Control infrastructure (C&C)
- The most prevalent Malware
- Top hosts flagged as being "Infected" by Sky ATP
 Sky ATP Dashboard
The Event Information Dashboard provides system-level information, such as account auditing, process status, command-line activity, and more.
 Event Information Dashboard
Configuring an SRX Series Next-Generation Firewall to forward events to Splunk:
Through Security Director:
- Go to Devices
- Right click your device
- Modify Configuration
- Security Logging
- Stream Configuration
- Add Splunk's details
 Adding Splunk via Security Director
Through J-Web
- Device Settings
- Basic Setup
- Logging
- Set Logging-Type to 'Stream' and enable 'Traffic Logs'
- Add Splunk's details
- Commit
 Adding Splunk via J-Web
Through the CLI:
- Enter configuration mode via 'edit' or 'configure'
- Add the correct information for your Splunk instance (IP address, port, SRX source interface if required, etc)
set security log mode stream
set security log source-interface <srx.interface>
set security log stream Splunk format sd-syslog
set security log stream Splunk host <ip.address.of.splunk>

# Commit the changes
commit and-quit